TL;DR: Time to Interactive (TTI) measures the time until a page is fully interactive, focusing on the gap between displaying content and usability. Optimizing it involves reducing JavaScript execution times through strategies such as code splitting, minification, and deferring non-essential scripts."
Fast websites can sometimes perform worse than slow ones.
Yes, you read that right.
No, that doesn’t mean page speed isn’t important. It’s crucial.
But page speed isn’t only about serving content. It’s about providing a visually complete and usable website.
In fact, focusing too much on the visuals and neglecting usability can ruin your visitors’ experience.
We’ll talk about why that is in a bit.
First, let’s discuss Time To Interactive (TTI).
What Is Time To Interactive (TTI)?
Time To Interactive (TTI) is the time it takes for a page to become fully interactive after a user arrives on it.
PageSpeed Insights (PSI) considers a page fully interactive when:
-
The page displays useful content;
-
Event handlers are registered for most visible page elements;
-
The page responds to user interactions within 50 milliseconds.
A few things to unpack here.
First, the FCP (First Contentful Paint) metric measures when a page starts displaying content.
TTI is reached only after FCP. Having a huge gap between these two metrics causes serious problems. More on that in a bit.
Second, event handlers are scripts that are automatically executed when an event occurs.
For example, a user clicking on a button is an event. Your website’s event handlers respond to this event by producing the required results.
If event handlers aren’t registered (especially for above-the-fold elements), your website won’t respond to the user input.
Which brings us to the third condition.
Responding to user interactions within 50ms is crucial for providing a seamless user experience. That’s often hard to do, as Long Tasks can block the main thread, causing a delay between user input and the app’s response.
I’ve talked about this issue in a previous article about Total Blocking Time (TBT).

It’s also important to note that TTI is a lab metric. It’s measured in a simulated environment, without input from real users. This makes it useful for debugging and finding specific performance issues.
However, real users might experience issues that lab data can’t report. That’s why you should also measure and optimize the field responsiveness metric - Interaction to Next Paint (INP).
Now, let’s talk about why neglecting usability can be disastrous.
Load Time vs. Interactivity
For most people, website performance equals speed. More specifically, the speed of delivering content to visitors.
And there’s nothing wrong with that. You should aim to serve content as quickly as possible.
But what happens when you only focus on content and neglect usability?
Rage clicks happen.
Rage clicks are our way of expressing frustration online. When a button doesn’t work, we spam the hell out of it until it does (or until we bounce).
Why do we do that?
Because when we see a visually complete page, we expect it to be interactive. If it isn’t, we rage click.
These actions quickly lead to increased bounce rates, lower conversions, and overall - a bad user experience.
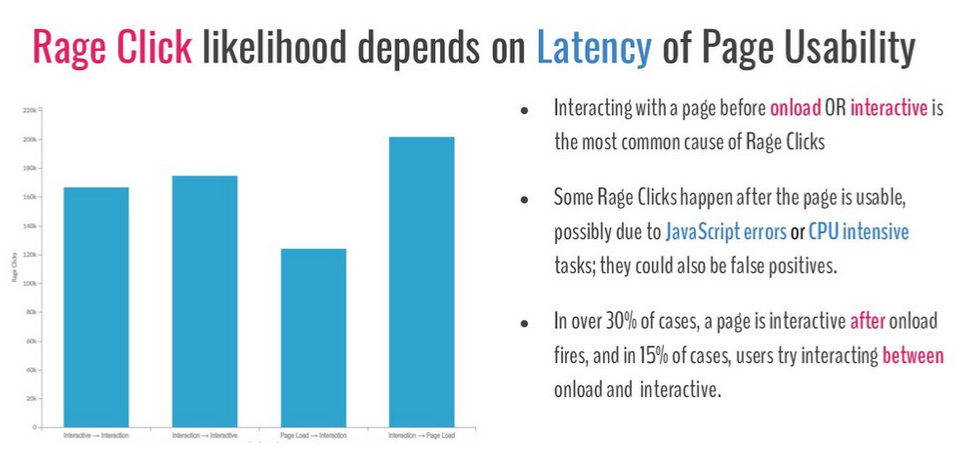
And what’s the number one reason for rage clicks?
The latency of page usability.

Source: UX & Performance: Metrics that Matter - https://bit.ly/35CWRSl
So, focusing exclusively on load speed can hurt your website if you disregard usability in the process.
That’s why some fast websites do worse than slow ones. They serve content instantly but remain unusable for too long.
As a result, their users see the visually ready UI and start clicking buttons. The buttons don’t work. The visitors get frustrated, they rage-click a bunch of times and bounce. End of story.
To summarize:
The interval between having a visually complete page and a usable one can make or break the user experience.

Keep it short.
Before I go into how to do that, you need to understand what causes a slow TTI.
What Causes A Slow TTI?
The biggest reason for slow TTI is the large amount of JavaScript modern websites have.
More specifically, Long JavaScript Tasks (all tasks longer than 50ms) can delay your TTI.
Here's why:
When rendering a page, modern browsers rely on the main thread to do a ton of tasks.

Long Tasks take up significant time on the main thread. And while they’re ongoing, the browsers can’t interrupt them.
If a user taps on a button during one of these tasks, the browser can’t respond to his input.

Put simply, the page is unresponsive until that task is finished.
So, by finding and optimizing Long Tasks, you can significantly improve your TTI.
Let’s see how you can locate them.
How To Find Long Tasks
The Chrome Dev Tools Performance audit can give you information about Long Tasks on the main thread.
Go to a page you want to analyze. Right-click, select “Inspect” and click on “Performance”. Click on the “Reload” button and wait for Chrome to do its thing.

You’ll get a detailed analysis of how the page performed.
In the “Main” section, you’ll see tasks painted in different colors. If you see a gray task with a small red overlay, you’ve found a Long Task.

When you hover over it, you’ll see how much time it takes up on the main thread.
You can also click on “Bottom-Up” to see a detailed description of each task.

From there, you can break down each activity and see what causes delays.
As you dive into specific tasks, you might find that some longer functions make up most of the delay. In other cases, functions might be run quickly but adding too many of them together in a single task results in a Long Task.
Regardless of the reason, splitting Long Tasks helps improve all interactivity metrics, including TTI.
You can also use a few techniques that can help improve your TTI.
Let’s quickly talk about those.
How to Improve TTI
Optimizing for interactivity metrics (TTI, TBT, and INP) is harder than optimizing for paint metrics.
That’s mainly because of how much JavaScript (JS) is involved in the process.
In general, a few JS optimizations will yield the biggest results when it comes to improving your TTI score:
-
Code Splitting. This allows your website to send only the code that your visitors need at the very beginning, instead of overloading the browser with all the JS at once;
-
Minification and compression. These techniques reduce code file size. They’re low effort, high reward optimizations. Even if you don’t have a problem with your website’s JS, you should still minify and compress your code;
-
Delay or remove non-critical third-party scripts. Third-party scripts can sometimes prevent your own scripts from executing on time. Consider which scripts provide the most value to the user and prioritize them. In most cases, ad and pop-up scripts aren’t at the top of the list;
-
Preload Critical Assets. With preloading, you tell the browser which resources to find and load first. You can do that by adding the link rel="preload" element;
-
Use web workers. Web workers allow you to run scripts in the background without affecting the Main Thread. Moving non-UI operations to a background thread is generally a good practice.
Web.dev also has a ton of other recommendations for JS optimization. You can (and should) check them out here.
NitroPack and JavaScript Optimization
Two of NitroPack’s biggest advantages are the way it handles resource loading and JavaScript execution.
First, our service minifies and compresses code files automatically. It also delays the loading of non-critical resources until user interaction is detected. This helps prioritize resources that matter to your website’s visitors.
We also have a Delayed Scripts feature that lets you specify which scripts you want to be loaded with a delay, outside of those we delay by default.

Most importantly, a huge reason why NitroPack produces outstanding speed results is our proprietary resource loading mechanism.
We don’t use built-in browser techniques. Instead, we created our own resource loader, which rearranges the way resources are fed to the main thread.

We do this to take advantage of modern CPU’s multi-core nature by offloading tasks away from the main thread. And as I already mentioned, freeing up the main thread is the most important benefit of JavaScript optimization.
But don’t take my word for it. Test NitroPack and see the results for yourself. Our free plan doesn’t expire or require a credit/debit card, so you can see the full power of NitroPack without risking anything.


